Monitoring and observability
Our Red Hat Developer Hub instance has a lot of content and provides services to their users. However, how could we measure it? Easy! There are a set of plugins to monitor the behavior of the users of Red Hat Developer Hub. Using the Adoption Insights plugin, we can enable a dashboard to visualize some interested metrics about the usage of the instance.
| Since Red Hat Developer Hub 1.7 this plugin is enabled by default. |
Run:
oc apply -f ./content/modules/ROOT/examples/exercises/dynamic-plugins-11.yaml -n rhdh-gitlab
oc apply -f ./content/modules/ROOT/examples/exercises/rhdh-app-configmap-11.yaml -n rhdh-gitlab
Since Red Hat Developer Hub 1.9 is easy to integrate it with the OpenShift Monitoring services using the user-defined projects. OpenShift can monitor user-defined projects in addition to the default platform monitoring. This feature allows monitoring your own projects in OpenShift without the need for an additional monitoring solution. Using this feature centralizes monitoring for core platform components and user-defined projects.
For detailed information, check the official documentation.
As cluster-admin enable the user-monitoring capabilities of OpenShift adding the enableUserWorkload variable in
the configuration of the OpenShift Monitoring. This configuration is described in the cluster-monitoring-config ConfigMap
of the openshift-monitoring namespace:
|
Run:
oc apply -f ./content/modules/ROOT/examples/exercises/cluster-monitoring-config-11.yaml -n openshift-monitoringThis new configuration will create the openshift-user-workload-monitoring namespace and a set of new components
will be deployed to capture the metrics of the user-defined projects. This command can check the status of those deployments:
on 🎩 ❯ oc get pod -n openshift-user-workload-monitoring
NAME                                   READY   STATUS    RESTARTS   AGE
prometheus-operator-6f766b4885-bsphx   2/2     Running   0          23s
prometheus-user-workload-0             6/6     Running   0          21s
prometheus-user-workload-1             6/6     Running   0          21s
thanos-ruler-user-workload-0           4/4     Running   0          20s
thanos-ruler-user-workload-1           4/4     Running   0          20s
As cluster-admin we can enable permissions to users to edit or view those objects.
For example, we can provide cluster roles to view and edit them as:
|
oc adm policy add-cluster-role-to-user monitoring-rules-view <user> -n <namespace>
oc adm policy add-cluster-role-to-user monitoring-edit <user> -n <namespace>
Integration between Red Hat Developer Hub and OpenShift Monitoring stack requires to
add the following configuration into the Backstage definition:
spec:
  monitoring:
    enabled: true
Or run:
oc apply -f ./content/modules/ROOT/examples/exercises/rhdh-instance-11.yaml -n rhdh-gitlabThis configuration will enable the metrics endpoint and integrate the metrics into the OpenShift Monitoring stack.
The metrics are exposed through an HTTP service endpoint under the /metrics canonical name. Additionally
the operator will create a ServiceMonitor object to scrape metrics from that service endpoint in a user-defined project.
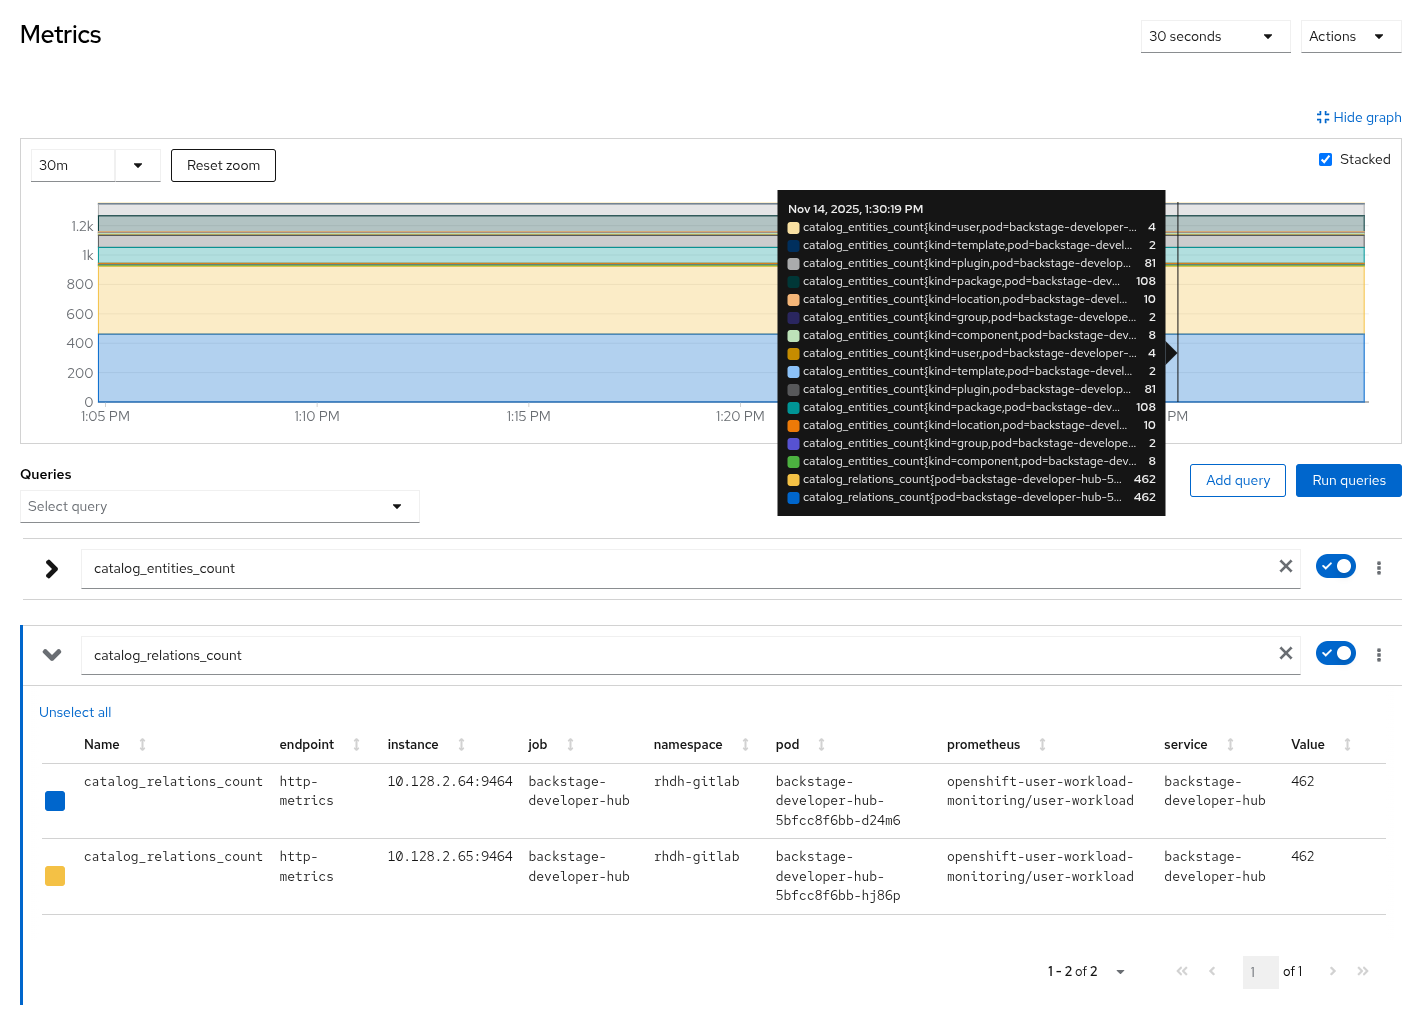
Once the ServiceMonitor is created, after some minutes to scrape some metrics, the user can visualize them from the Developer perspective in OpenShift in the .
For example, the following metrics can be reviewed: catalog_relations_count, catalog_entities_count.
Regarding the logs generated (audit-log), those logs are collected by the OpenShift Logging stack.
We can filter audit logs from the OpenShift UI by using the isAuditLog field.
This procedure is similar to:
-
From the Developer perspective of the OpenShift web console, click the Topology tab.
-
From the Topology view, click the pod that you want to view audit log data for.
-
From the pod panel, click the Resources tab.
-
From the Pods section of the Resources tab, click View logs.
-
From the Logs view, enter
isAuditLoginto the Search field to filter audit logs from other log types. You can use the arrows to browse the logs containing theisAuditLogfield.